Elboxrf's Microstrip Antennas
- My name is Przemyslaw Fert and I am Electronics Engineer specializing in the electromagnetic (EM) simulation and developing of microstrip antennas - the first 433 MHz planar microstrip antenna I developed in 1995 was for the Radio Frequency Identification System.
- My first serious measurement gear I arranged in 1998, was the Tektronix 492 spectrum analyzer and the 11692D dual directional coupler from Hewlett-Packard (then Agilent and now Keysight). Both instruments were configured in such way that they worked as the scalar analyzer in the band 2 - 18 GHz, so that I was sable to observe the matching of the connected antenna, or DUT (Device Under Test) directly on the screen in the log scale.
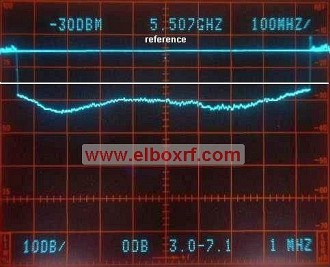
- Screens were photographed and screenshots were published as the confirmation of the quality developed antennas. Here is the impedance matching of TetraAnt 5 60 14 RSLL taken from the combo Tek 492 + 11692D in 2005, when the antenna was developed and manufactured.
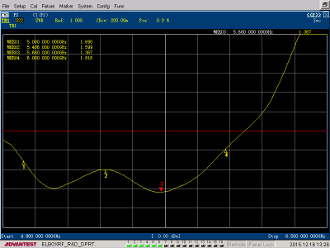
Below you will find the similar measurement (the previous one was S11 in the log scale, later is in VSWR) but taken in 2016 by my ADVANTEST R3860A RF component analyzer. The DUT was also the same model that is still in production since 2003, so I can say that the properly designed antenna needs no changes.
- This early instruments configuration was important to me - it presented quality of my products to potential customers. In many cases it was also used to help my clients to find out problems in their internet networks..
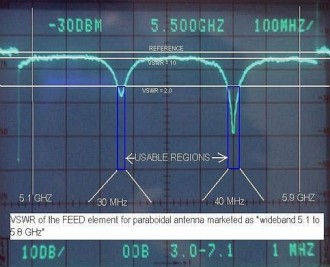
The following picture is the impedance matching of the wideband 5.1 to 5.8 GHz feed element for paraboloidal reflector antenna, that clearly explain why the client's antenna did not worked. In this case the VSWR is lower than 2.0 at very limited portion of the frequency; under and above this point the VSWR is much higher than the acceptable 2.0
Note that this measurement was done in 2005
Advanced Technology
- Since 2007 new investments in sophisticated soft and hardware was important step to gain strength of my company. Industry leading EM simulation software open the door to developing very precise planar and three dimensional structures up to hundred GHz, although I am limited in my measurements to 20 GHz because of the R3860 upper frequency limitation.
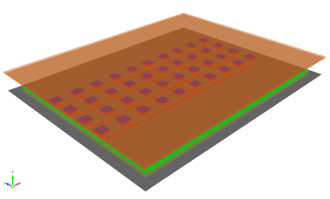
The following picture shows the 2.5D EM simulator on the way of developing 9.6 GHz microstrip planar antenna featured reduced sidelobe level. This structure is the 10 x 4 matrix of radiating elements. In open windows we can see some of simulation data: S11 on the Smith chart, real and imaginary impedance components and so on. The important part is the 3D radiation characteristics visualization.
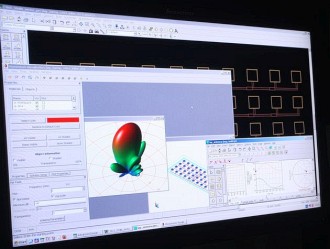
This useful feature allows the overall radiation checking and finding for example where sidelobes are. As I mentioned earlier in this simulator we can see only the half sphere of radiation pattern, because of existence the infinity ground plane what was the background for this kind of the simulation method
- I am using two electromagnetic simulators from two software companies for my daily work. One is for 2.5D simulation and allows very comprehensive visualization of simulation results (with mentioned earlier limitations) and the second one is full 3D soft without limitations. I like to work with both because of a few nuances they have.
Here is the result of the geometry set up for 3D electromagnetic simulation. The antenna is modeled in the simulation space and then feed by the wideband impulse then the response is processed for easy visualization.
Simulation Examples
- Find please a few examples of results for the 9.6 GHz microstrip antenna with the reduced sidelobe level.

3D simulation - the visualization of the radiation pattern. Colours allow for checking the intensity of the electromagnetic wave. Cold colours are for the lowest intensity, hottest ones are for the highest intensity.
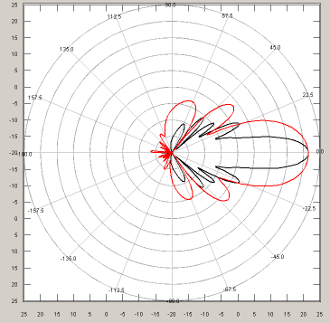
3D simulation - the two dimensional visualization of the radiation. The trained eye will see the low level of sidelobes, roughly - 20 dB below the main beam and also the low level of the back radiation.
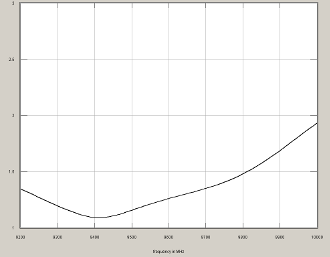
3D simulation - the impedance matching or VSWR. This prototype has a very good matching, less than 2.0 in the band 9.2 to 10 GHz, but do not expect that the radiation properties will be the same in the whole band.
RF & Microwave Instruments
- The next step after the antenna was modeled is making a prototype. In this step I can verify if everything went well. Although the simulation software is very accurate, it is as good as the data you put in it. The rule "garbage in - garbage out" works extremely well in this case.
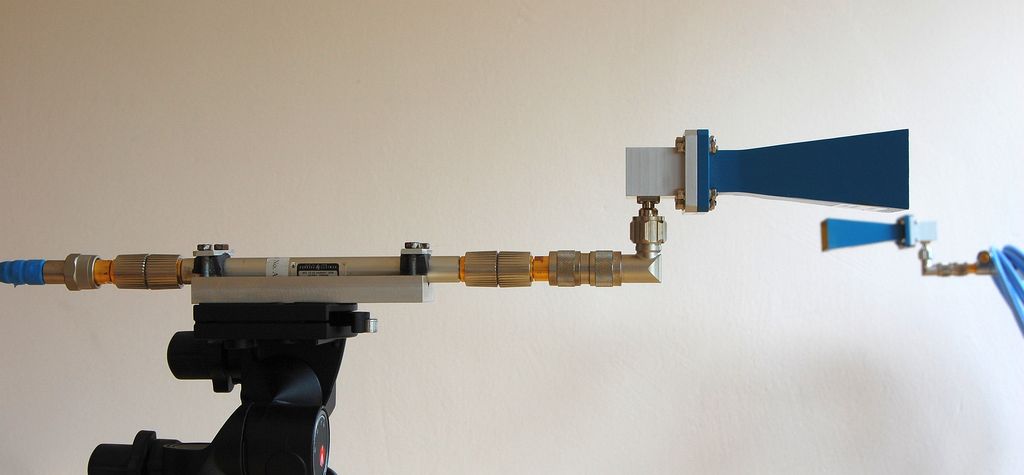
The set of the standard horn gain antenna with known and accurate gain. The measurement set-up consists the vector analyzer and waveguide horn antennas connected by a 10m long the very low loss and a phase stable coaxial cables.
- The measurement is done by the Advantest R3860 RF Component Analyzer alone (the impedance matching and couplings between ports or connectors) or with the help of the gain standard antenna. In the latter case I can verify if the antenna gain is in the reasonable tolerance compared to the simulation results.
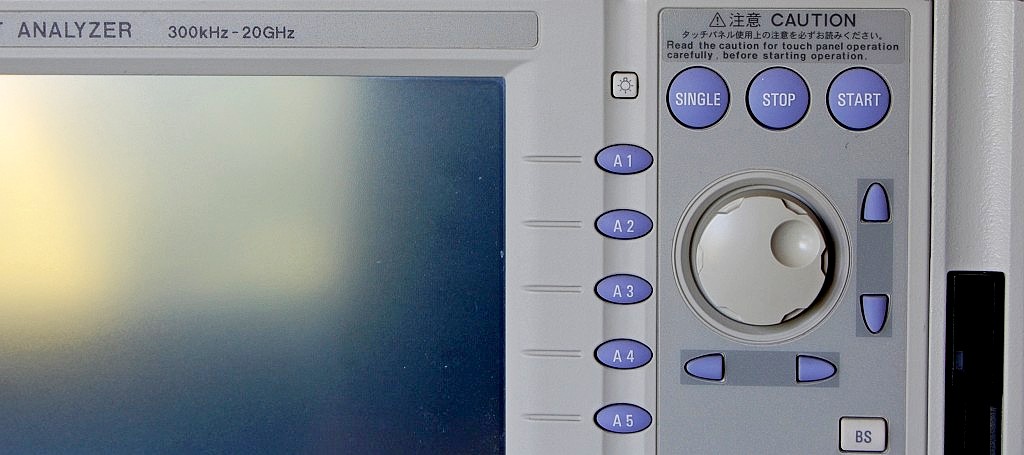
Advantest R3860A RF COMPONENT ANALYZER - the workhorse in my laboratory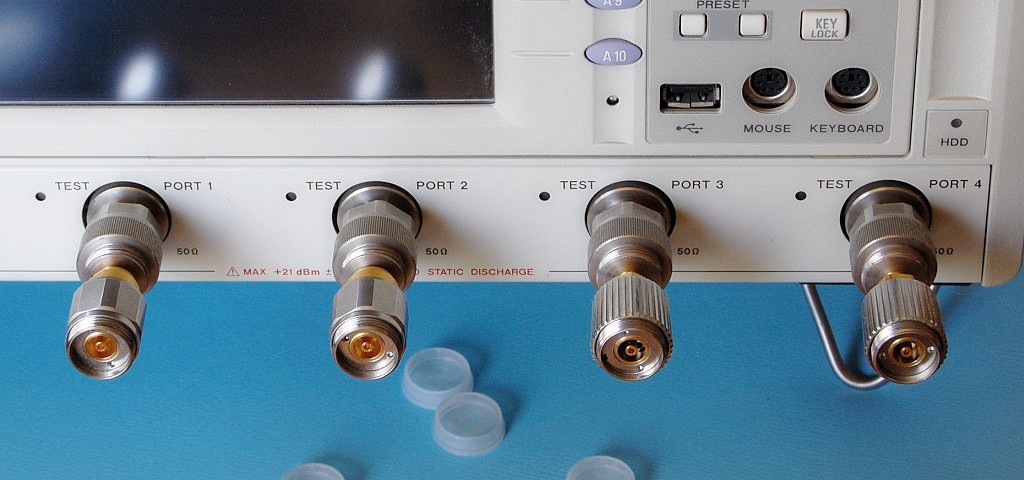
Multiple ports allow for a very accurate and simultaneous measurement of the impedance matching and mutual couplings for 4x4 MIMO antennas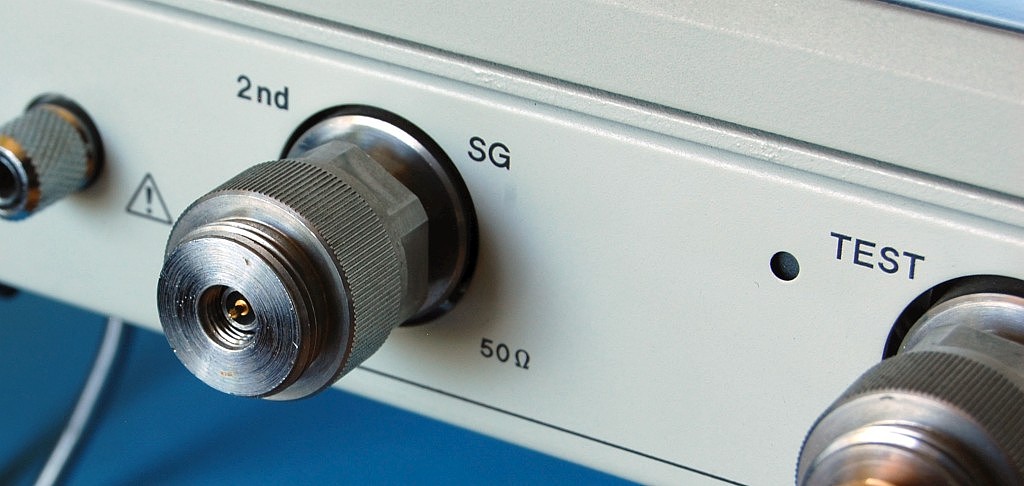
R3860A has also the Signal Generator for the 300kHz to 20 GHz. Very useful option for the mixer and active devices measurements.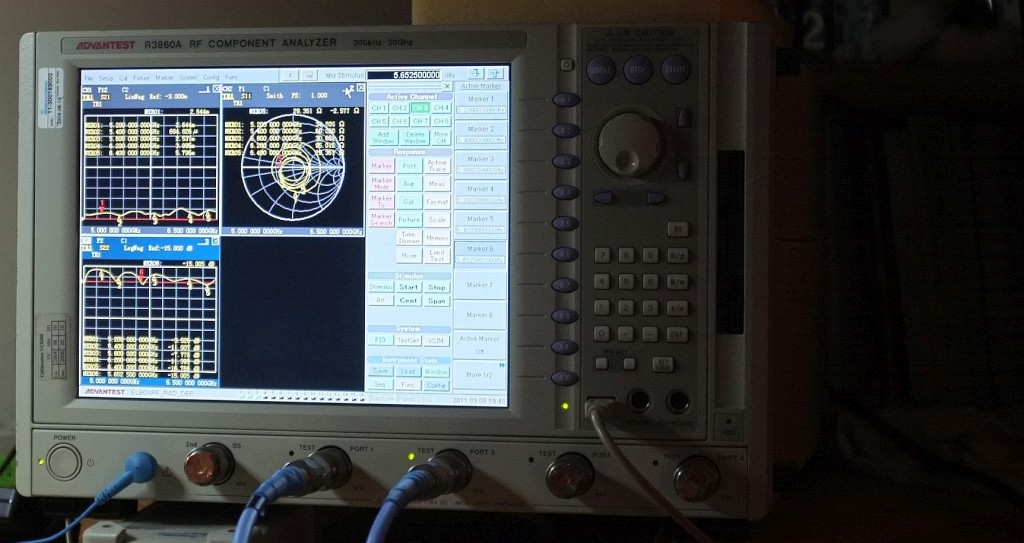
R3860A connected to the distant antenna.